import os

import pandas as pdData Science
Intro to data science with Python
Convert Jupyter Notebook to static HTML: $ jupyter nbconvert --to html NOTEBOOK-NAME.ipynb
data_dir = "./data/titanic"
d_test = os.path.join(data_dir, "test.csv")
d_train = os.path.join(data_dir, "train.csv")
df = pd.read_csv(d_train)
df| PassengerId | Survived | Pclass | Name | Sex | Age | SibSp | Parch | Ticket | Fare | Cabin | Embarked | |
|---|---|---|---|---|---|---|---|---|---|---|---|---|
| 0 | 1 | 0 | 3 | Braund, Mr. Owen Harris | male | 22.0 | 1 | 0 | A/5 21171 | 7.2500 | NaN | S |
| 1 | 2 | 1 | 1 | Cumings, Mrs. John Bradley (Florence Briggs Th... | female | 38.0 | 1 | 0 | PC 17599 | 71.2833 | C85 | C |
| 2 | 3 | 1 | 3 | Heikkinen, Miss. Laina | female | 26.0 | 0 | 0 | STON/O2. 3101282 | 7.9250 | NaN | S |
| 3 | 4 | 1 | 1 | Futrelle, Mrs. Jacques Heath (Lily May Peel) | female | 35.0 | 1 | 0 | 113803 | 53.1000 | C123 | S |
| 4 | 5 | 0 | 3 | Allen, Mr. William Henry | male | 35.0 | 0 | 0 | 373450 | 8.0500 | NaN | S |
| ... | ... | ... | ... | ... | ... | ... | ... | ... | ... | ... | ... | ... |
| 886 | 887 | 0 | 2 | Montvila, Rev. Juozas | male | 27.0 | 0 | 0 | 211536 | 13.0000 | NaN | S |
| 887 | 888 | 1 | 1 | Graham, Miss. Margaret Edith | female | 19.0 | 0 | 0 | 112053 | 30.0000 | B42 | S |
| 888 | 889 | 0 | 3 | Johnston, Miss. Catherine Helen "Carrie" | female | NaN | 1 | 2 | W./C. 6607 | 23.4500 | NaN | S |
| 889 | 890 | 1 | 1 | Behr, Mr. Karl Howell | male | 26.0 | 0 | 0 | 111369 | 30.0000 | C148 | C |
| 890 | 891 | 0 | 3 | Dooley, Mr. Patrick | male | 32.0 | 0 | 0 | 370376 | 7.7500 | NaN | Q |
891 rows × 12 columns
Question
Predict who would survive and who won’t
Explore the data
# rows, columns
df.shape
(891, 12)# bits of data (rows x columns)
df.size10692# shows summary of numerical data types
df.describe()| PassengerId | Survived | Pclass | Age | SibSp | Parch | Fare | |
|---|---|---|---|---|---|---|---|
| count | 891.000000 | 891.000000 | 891.000000 | 714.000000 | 891.000000 | 891.000000 | 891.000000 |
| mean | 446.000000 | 0.383838 | 2.308642 | 29.699118 | 0.523008 | 0.381594 | 32.204208 |
| std | 257.353842 | 0.486592 | 0.836071 | 14.526497 | 1.102743 | 0.806057 | 49.693429 |
| min | 1.000000 | 0.000000 | 1.000000 | 0.420000 | 0.000000 | 0.000000 | 0.000000 |
| 25% | 223.500000 | 0.000000 | 2.000000 | 20.125000 | 0.000000 | 0.000000 | 7.910400 |
| 50% | 446.000000 | 0.000000 | 3.000000 | 28.000000 | 0.000000 | 0.000000 | 14.454200 |
| 75% | 668.500000 | 1.000000 | 3.000000 | 38.000000 | 1.000000 | 0.000000 | 31.000000 |
| max | 891.000000 | 1.000000 | 3.000000 | 80.000000 | 8.000000 | 6.000000 | 512.329200 |
df.info()

# dtype of "object" means column is incomplete (missing value) and datatype cannot be determined
<class 'pandas.core.frame.DataFrame'>
RangeIndex: 891 entries, 0 to 890
Data columns (total 12 columns):
# Column Non-Null Count Dtype
--- ------ -------------- -----
0 PassengerId 891 non-null int64
1 Survived 891 non-null int64
2 Pclass 891 non-null int64
3 Name 891 non-null object
4 Sex 891 non-null object
5 Age 714 non-null float64
6 SibSp 891 non-null int64
7 Parch 891 non-null int64
8 Ticket 891 non-null object
9 Fare 891 non-null float64
10 Cabin 204 non-null object
11 Embarked 889 non-null object
dtypes: float64(2), int64(5), object(5)
memory usage: 83.7+ KBdf.sample()| PassengerId | Survived | Pclass | Name | Sex | Age | SibSp | Parch | Ticket | Fare | Cabin | Embarked | |
|---|---|---|---|---|---|---|---|---|---|---|---|---|
| 368 | 369 | 1 | 3 | Jermyn, Miss. Annie | female | NaN | 0 | 0 | 14313 | 7.75 | NaN | Q |
df.columnsIndex(['PassengerId', 'Survived', 'Pclass', 'Name', 'Sex', 'Age', 'SibSp',
'Parch', 'Ticket', 'Fare', 'Cabin', 'Embarked'],
dtype='object')Accessing pandas dataframe columns
df["Fare"] = 0
df.sample()| PassengerId | Survived | Pclass | Name | Sex | Age | SibSp | Parch | Ticket | Fare | Cabin | Embarked | |
|---|---|---|---|---|---|---|---|---|---|---|---|---|
| 250 | 251 | 0 | 3 | Reed, Mr. James George | male | NaN | 0 | 0 | 362316 | 0 | NaN | S |
Delete a column
del df["Cabin"]
df.sample()| PassengerId | Survived | Pclass | Name | Sex | Age | SibSp | Parch | Ticket | Fare | Embarked | |
|---|---|---|---|---|---|---|---|---|---|---|---|
| 699 | 700 | 0 | 3 | Humblen, Mr. Adolf Mathias Nicolai Olsen | male | 42.0 | 0 | 0 | 348121 | 0 | S |
# reset dataframe
df = pd.read_csv(d_train)
Crosstab, countplot, factorplot
import seaborn as snsdf.sample()| PassengerId | Survived | Pclass | Name | Sex | Age | SibSp | Parch | Ticket | Fare | Cabin | Embarked | |
|---|---|---|---|---|---|---|---|---|---|---|---|---|
| 79 | 80 | 1 | 3 | Dowdell, Miss. Elizabeth | female | 30.0 | 0 | 0 | 364516 | 12.475 | NaN | S |
Crosstab
pd.crosstab(df["Sex"], df["Survived"])| Survived | 0 | 1 |
|---|---|---|
| Sex | ||
| female | 81 | 233 |
| male | 468 | 109 |
pd.crosstab(df["Pclass"], df["Survived"])| Survived | 0 | 1 |
|---|---|---|
| Pclass | ||
| 1 | 80 | 136 |
| 2 | 97 | 87 |
| 3 | 372 | 119 |
Countplot - visualization
ax = sns.countplot(x="Sex", hue="Survived", palette="Set1", data=df)
ax.set(title="Survivors according to Sex", xlabel="Sex", ylabel="Total")
[Text(0.5, 1.0, 'Survivors according to Sex'),
Text(0.5, 0, 'Sex'),
Text(0, 0.5, 'Total')]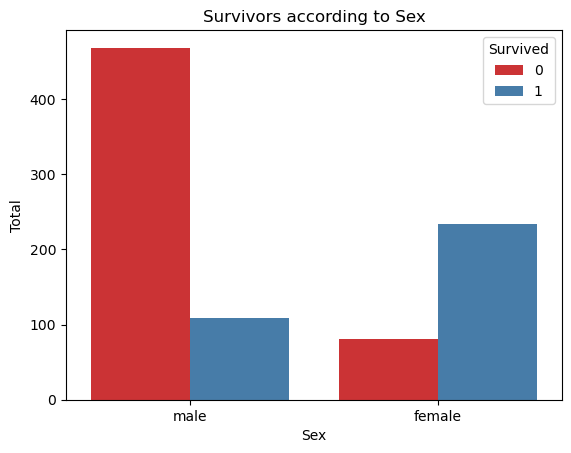
Factorplot - looking at multiple columns
sns.factorplot(x="Pclass", y="Survived", hue="Sex", data=df, aspect=0.9, size=3.5)--------------------------------------------------------------------------- AttributeError Traceback (most recent call last) Cell In[20], line 1 ----> 1 sns.factorplot(x="Pclass", y="Survived", hue="Sex", data=df, aspect=0.9, size=3.5) AttributeError: module 'seaborn' has no attribute 'factorplot'
Factorplot has since been changed to catplot. Specifying the plot “kind” parameter to “point” yields same output as “factorplot”
# sns.factorplot(x="Embarked", y="Survived", hue="Sex", data=df, aspect=0.9, height=3.5)
sns.catplot(kind="point", x="Embarked", y="Survived", hue="Sex", data=df, aspect=0.9, height=3.5)
/opt/conda/lib/python3.11/site-packages/seaborn/axisgrid.py:118: UserWarning: The figure layout has changed to tight
self._figure.tight_layout(*args, **kwargs)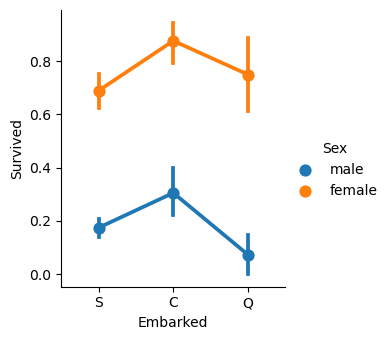
Variable Types
Dependent vs Independent variable types
- Categorical
- Nominal - Any number of categories, order not important (eg male or female)
- Ordinal - Order is important (eg educational background)
- Numerical
- Discrete - Count, dice throwing, etc.
- Continuous - Height of a person, weight, height of a tree, speed of a car.
4 Cs of data science
- Correcting - Outliers, data seems incorrect
- Completing - NULL values
- Creating - Feature engineering, use existing features to create new ones that may be helpful
- Converting - male = 1, female = 0